Automation
Type: Dashboard
Functions
• Analyze process performance indicators related to automation such as automation rates, no touch (completed automated) rates, and the lead time of no touch processes
• Detect process steps that generate the most manual efforts
• Analyze process steps that generate the most manual efforts
• Flexible Analysis by any given process context to validate most effective automation measures
Business Benefits
• Overview on and monitoring of the current automation level
• Detect process steps that save the most resources when automated
• Calculate potential automation savings
• Priority-based decision-making for digitization measures
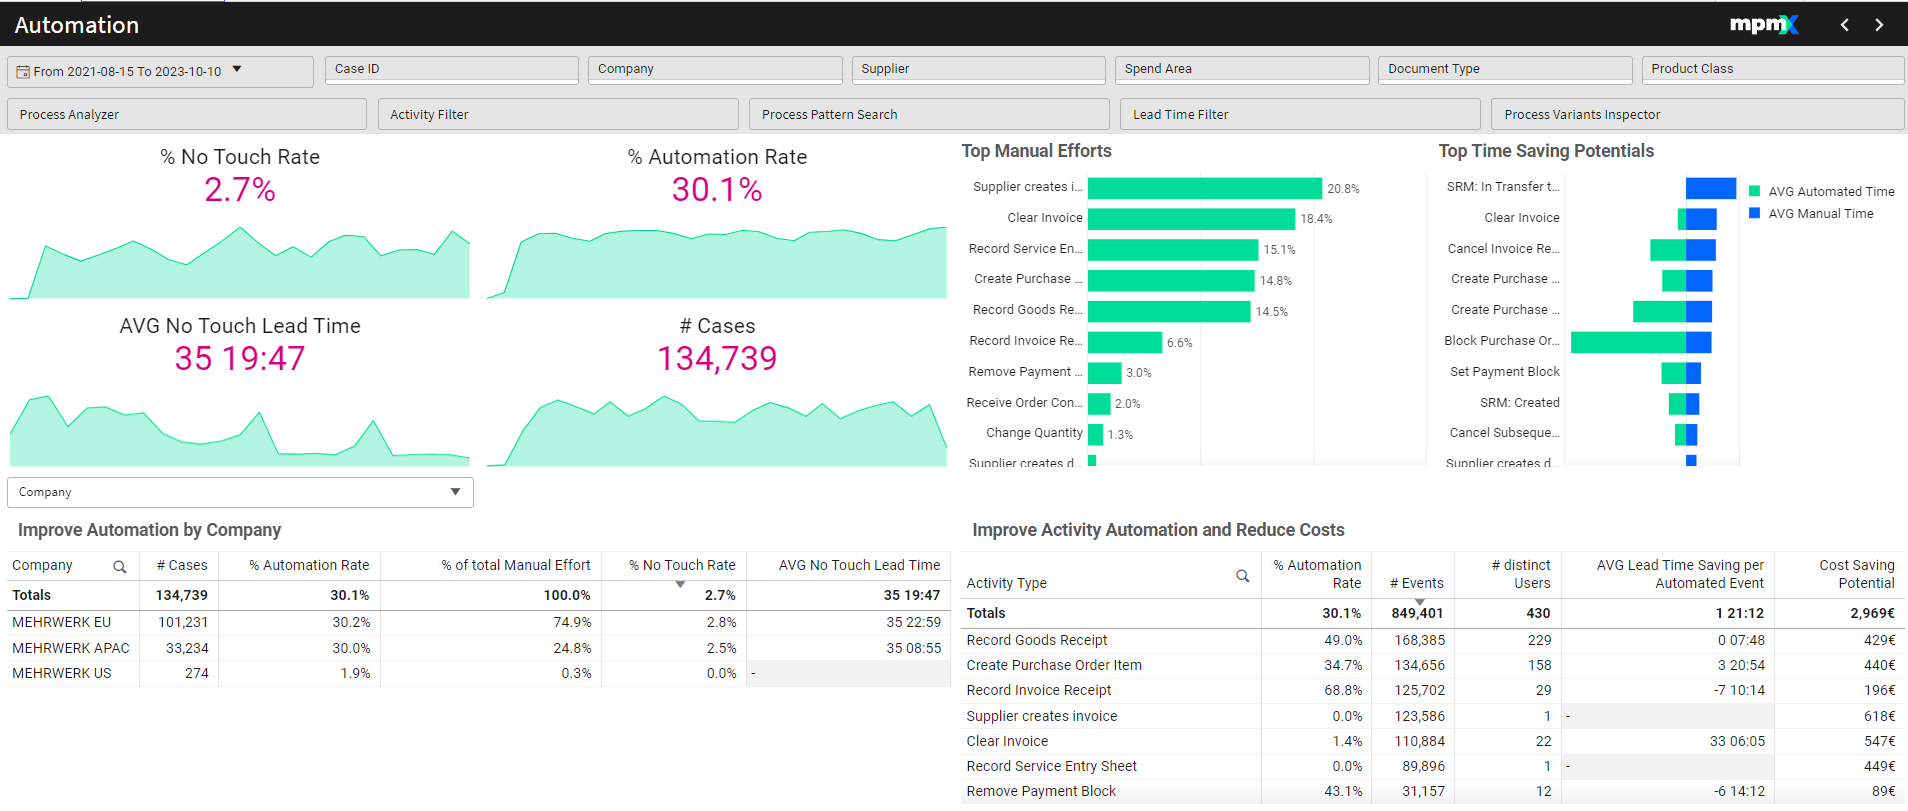
Interpreting the Visualizations
Key Figures
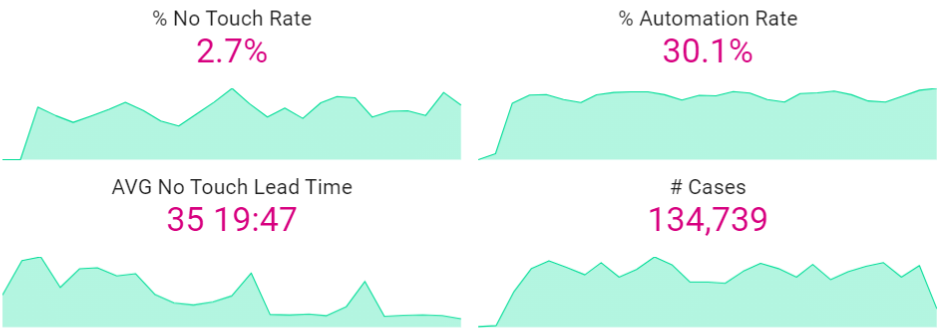
The key figures show you the status of the your filtered selection, with a timeline underneath to show how they have changed over time. The ideal situation has a high no touch rate.
% No Touch Rate
- The No Touch Rate gives you the percentage of cases in a process that are fully automated, so not a single event in the process was carried out manually.
📝 Note: If this definition is too strict, remember that you can always change the definition of every PPI. For example, in a P2P process you could define no touch cases as those that have automated the steps Creation, Invoice Creation, and Payment.
% Automation
- Shows the percentage of events that are automated, in comparison to all events. The ideal situation has a high automation rate.
No Touch Lead Time
- This shows the average lead time for the process variants which are fully automated. Ideally, this figure should be low.
# Cases
- Shows the total number of cases that are being processed with the current automation level. With more automation you could be more efficient - either complete more cases with the same resources or complete the same number of cases by using fewer resources (saving money).
Top Manual Efforts Chart
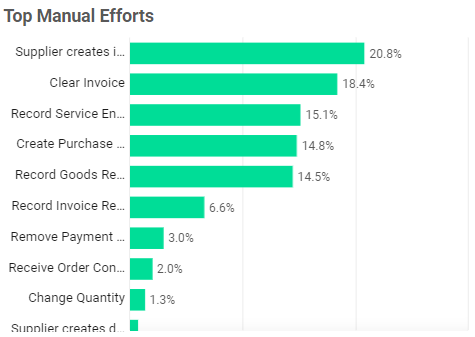
To the right of the KPIs is the bar chart indicating the activites that account for the most manual work. Automating the highest step(s) here could have a big impact. Selecting one of these items filters on it and the KPIs and tables below change to reflect this selection.
Top Time Saving Potentials Chart
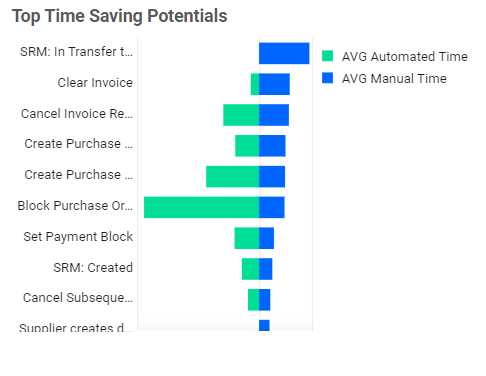
Here you see various activities and how often they are completed manually or automated.
Hover over the activity name to see a popup showing the total manual time and the average lead time saving (across all variants that include it) by fully automating that event.
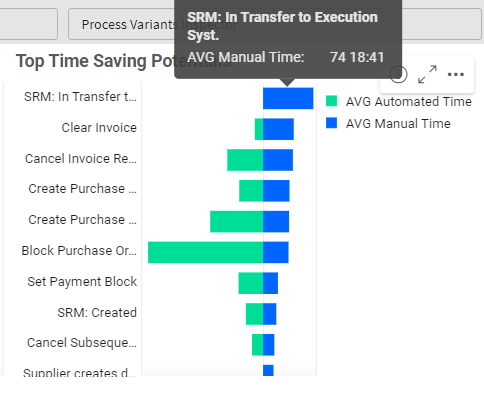
Selecting an activity in this chart will result in all KPIs and tables changing to reflect the selection. Sometimes an activity which adds a lot of lead time only affects a small number of cases and so may not have as big of an impact overall as compared to an activity with a medium lead time saving which affects a large majority of cases.
Improve Automation by (Dimension) Table
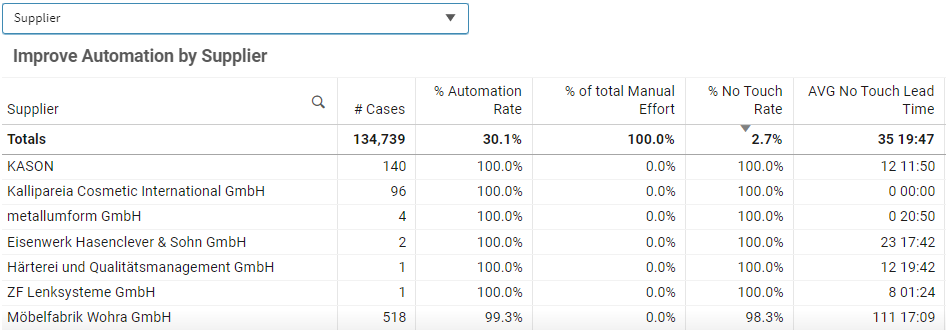
You can select one or more rows in this table to drill down further.
Improve Activity Automation and Reduce Costs Table
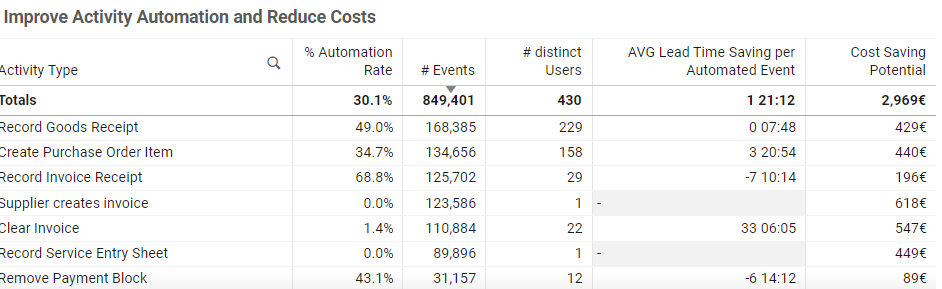
Found in the lower right corner, this table displays various information about specific acitivities.
The Cost Saving Potential is calculated by multiplying the following factors:
- the number of events
- duration of each event
- percentage of events that could be automated
- cost per minute of work
This calculation includes a lot of assumptions, but is meant as a standard formula which can be customized.
Click here for more information on how to set up Cost Calculations.